Mastering AWS EKS Logging with Elasticsearch
When you start building a Kubernetes cluster in AWS, one of the first things you need to think about is how to store and centralize the logs coming from nodes, containers or processes. A commonly used solution to solve this problem is to send your logs to Elasticsearch.
- It scales horizontally.
- You can store up to 3 PB of data in a single cluster (if you can afford it).
- Because of the Inverted index, you can do a “free search” in all your logs fairly quickly.
- You can create your data structure and index some fields to improve your searching capabilities.
- The Kibana plugin allows you to create amazing dashboards on top of these logs.
The problem with using Elasticsearch is that, just like most storage solutions, it is hard to manage and operate. Using the AWS Managed Elasticsearch comes with some advantages.
- It’s already in AWS - You don’t have to create a new account or go over all the company procurement for getting a new tool.
- It can be tightly integrated with the entire AWS IAM. If you already follow the least privilege best practice for your infrastructure resources, with the managed AWS solution, you can use the same familiar tool. Since Feb 2020, you can use roles to define granular permissions for indices, documents, or fields and to extend Kibana with read-only views and secure multi-tenant support.
- You can take advantage of Ultrawarm, a S3-backed storage that promises to reduce storage costs by up to 90% over hot storage. This was very recently added to the AWS’ offer(May 2020).
If choose AWS Elasticsearch, you have to decide how to handle permissions and access to your cluster. The recommended way of doing it is to create an AWS Elasticsearch domain with a private VPC endpoint and a security group open only where it is needed, and to use the Access Policy and IAM to do Fine-Grained Access Control. All these controls are extremely powerfully, and you can use them to make sure that only the pod responsible for aggregating logs can write to your Elasticsearch and use AWS Cognito to manage accesses and permissions to your Kibana dashboard. You can learn how to use Cognito to access Kibana from within the internet here.
Prerequisites
Before you continue with this guide, there are some things you should have already set up:
- A working EKS cluster. If you don’t have one, I recommend eksctl.
- Setup IAM roles for service accounts in your cluster.
- A working AWS Elasticsearch cluster.
Setup
In this example, we will use Fluentd to grab logs from our cluster and send it to the AWS Managed Elasticsearch using IAM for authentication.

The biggest struggle when using Fluentd to send logs to the managed AWS Elasticsearch is the AWS Signature Version 4 that you need to do on all requests. One of the easiest ways to solve this problem is to use a helm chart created by the Kiwigrid team, which uses a sidecar that will work as a proxy and sign all requests from Fluentd to Elasticsearch. The chart can be found here.
1. Create a new namespace
|
|
2. Setup IAM and Service Account
Let’s start by setting some variables that we can use later:
|
|
Make sure to replace the placeholders with the correct values:
|
|
Create an IAM policy to access our Elasticsearch domain:
|
|
We will be using eksctl to create the service account because it abstracts
a lot of steps and creates everything for us (IAM role, Trust policy, ServiceAccount, etc.).
|
|
3. Setup Elasticsearch access policy
Get the ARN of the role you just created:
|
|
Edit the access policy of your Elasticsearch cluster so that your newly created IAM Role can access it. As an example, the following yaml gives the roles permissions to do everything in your domain (you should be a bit more mindful in a production environment):
|
|
4. Install Fluentd
Add the kiwigrid repo to you helm:
|
|
Install Fluentd:
|
|
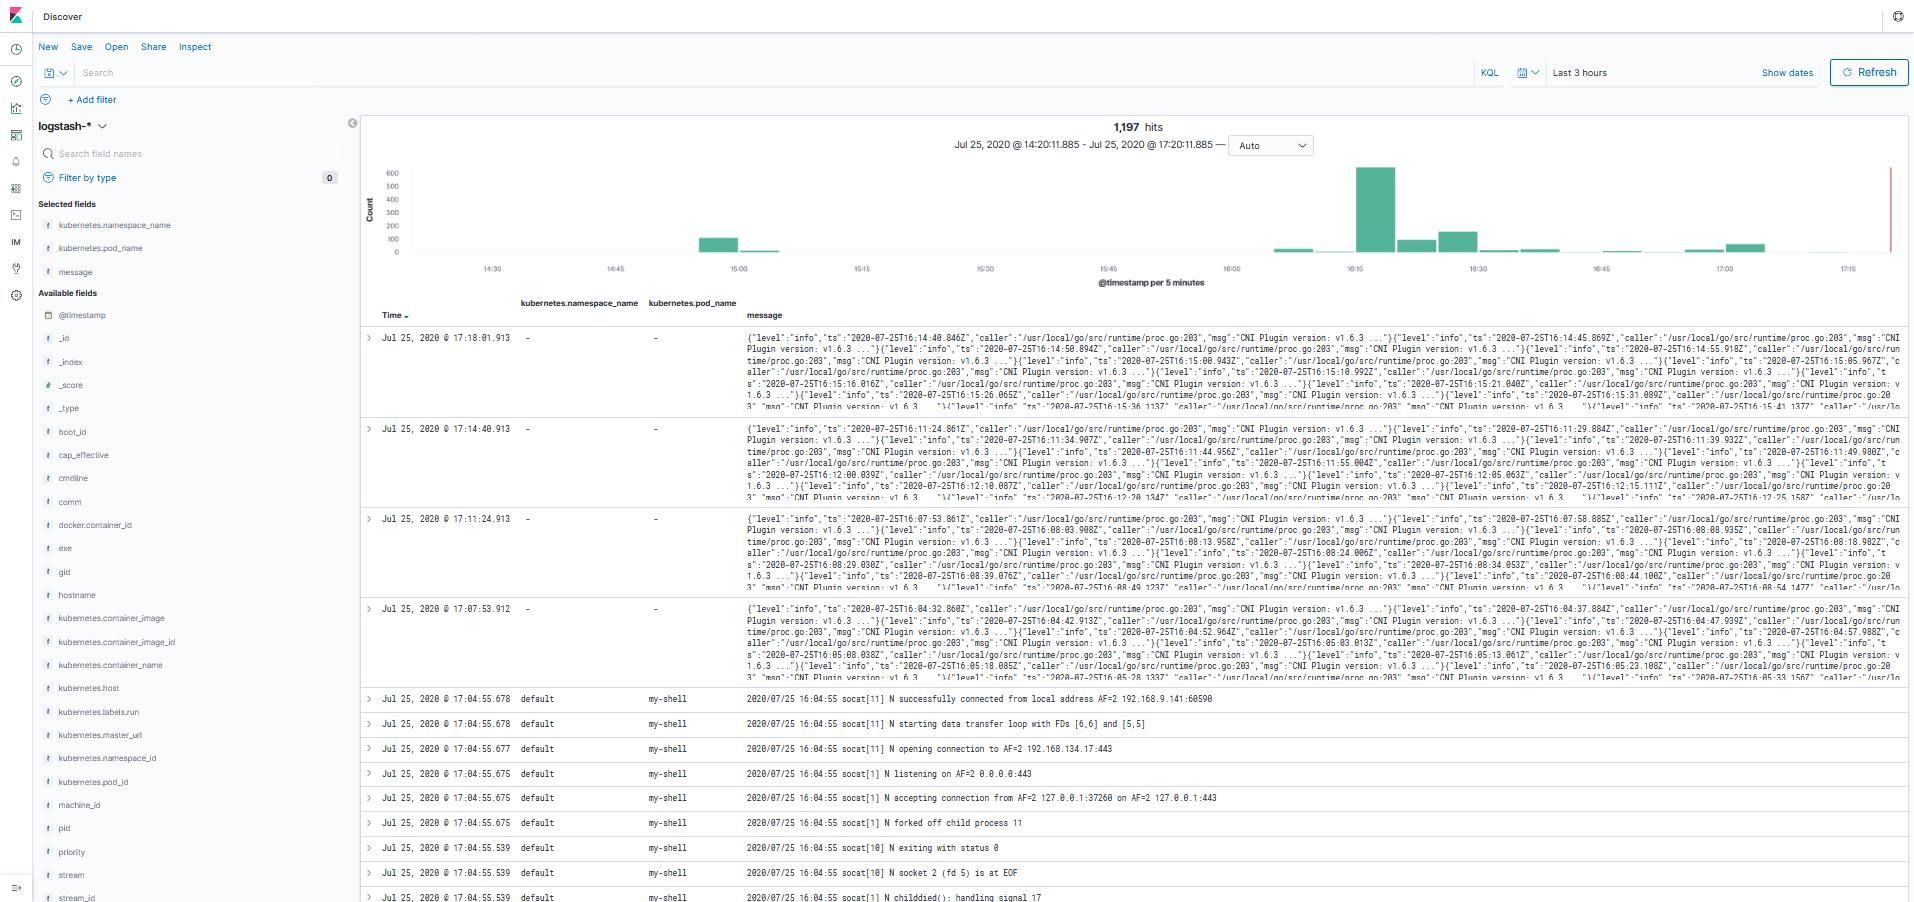
5. View logs in Kibana
Now, if you enter the Kibana dashboard ,you should find a new index with the name logstash-xxxx. Just create a new index
mapping, set the timestamp fields as the time key, and you should be able to see the logs from all your pods and nodes.